

Anticipating Risks, Connecting Evidence, and Acting Collectively
A space to anticipate, understand, and act in response to one of the most influential climate phenomena affecting agrifood systems in Latin America and the Caribbean.
El Niño generates deep and recurring impacts: prolonged droughts, floods, crop losses, disruptions to fisheries, and increased price volatility. These effects not only threaten production, but also rural livelihoods, food supply, and market stability.
In a context of increasing climate variability and more frequent and intense extreme events, the challenge is not only to respond to crises, but to strengthen the capacity of agrifood systems to anticipate, adapt, and build resilience.
This dialogue space aims to bring together evidence, experiences, and policy tools to reduce vulnerabilities and better manage risks associated with El Niño. Key topics include early warning systems, water management, agricultural insurance, climate-resilient practices, and institutional coordination mechanisms.
Rather than reacting to emergencies, the goal is to move toward integrated strategies that combine prevention, adaptation, and transformation.
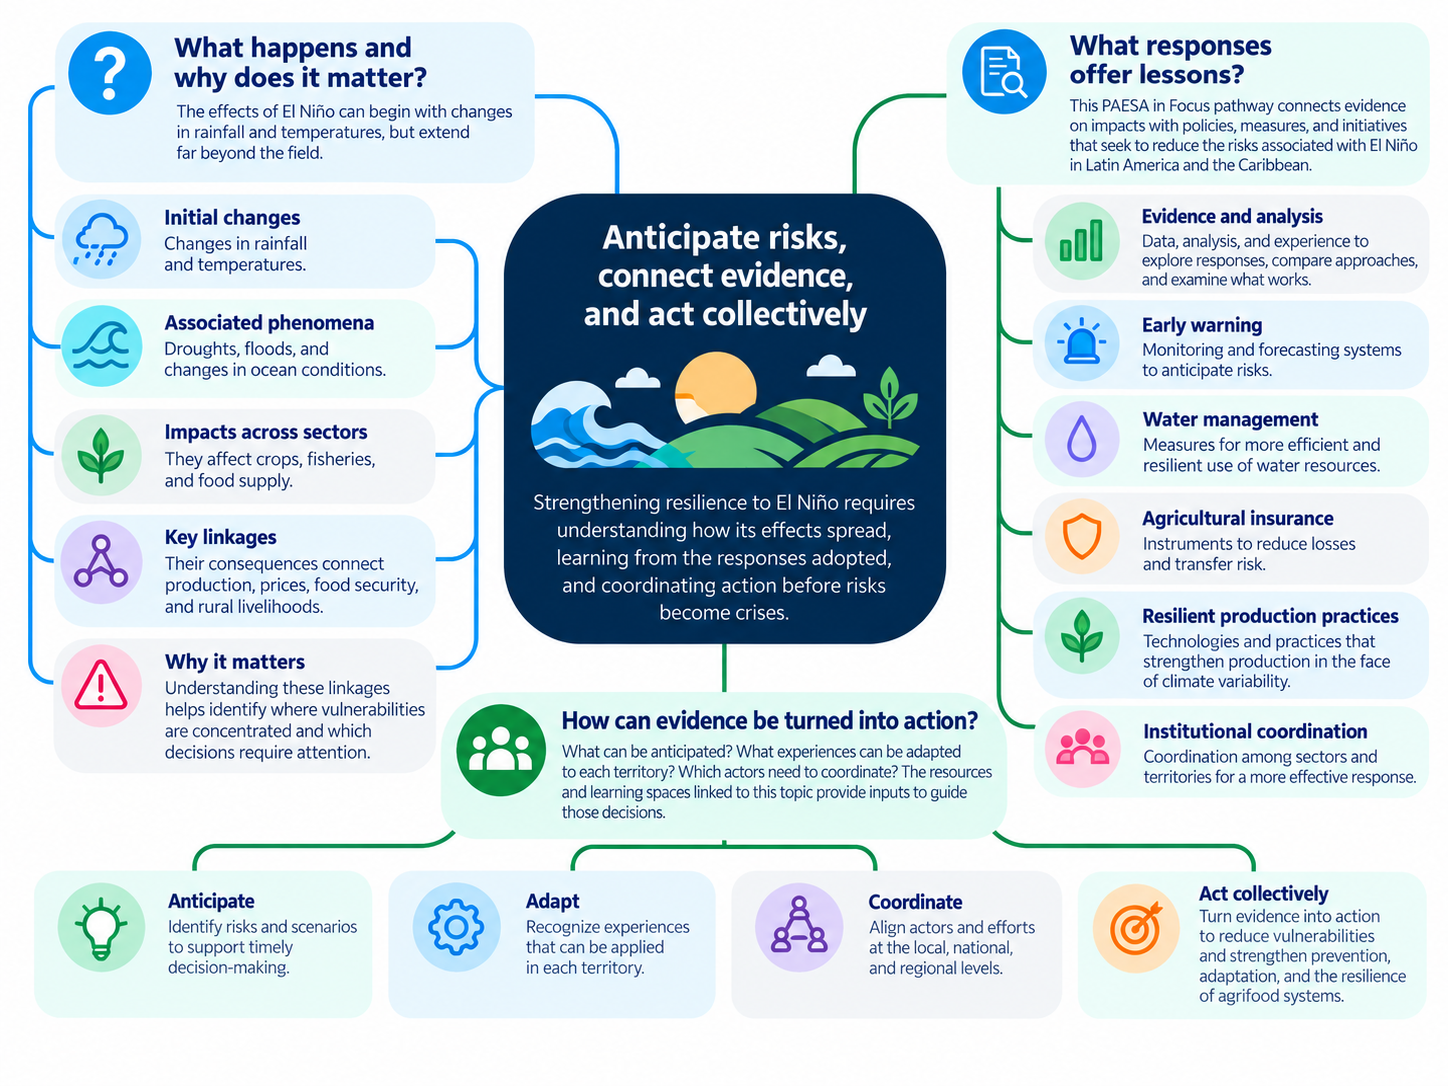
Understand the risk and why it matters
El Niño, the warm phase of the El Niño–Southern Oscillation (ENSO), alters oceanic and atmospheric conditions and can affect rainfall and temperature patterns across different regions. Its effects on agrifood systems may include droughts, floods, water stress, and disruptions to marine ecosystems, with consequences for production, markets, and livelihoods.
The magnitude of these impacts depends not only on the intensity of the phenomenon, but also on the exposure, vulnerabilities, and response capacities of each territory. Understanding these relationships helps anticipate risks and identify priorities for prevention and adaptation.
From the climate phenomenon to its impacts on agrifood systems

Exploring the context from different perspectives
PAESA indicators make it possible to examine economic and productive conditions, adaptation capacities, and trade linkages that may amplify or mitigate the effects of El Niño.
01 · Economic and Agricultural Context
How does agricultural activity perform relative to the overall economy?
Compare, by country, annual changes in gross domestic product (GDP) and agricultural value added. The shaded bands identify periods associated with El Niño episodes, making it possible to explore differences in the behavior of both variables without directly attributing economic fluctuations to the climate phenomenon.
The results illustrate the diversity of experiences across the Americas. In El Salvador, where territories within the Central American Dry Corridor are particularly exposed to drought, agricultural value added contracted by 5.5% in 2015 and grew by 8.3% in 2016, during the 2015–2016 El Niño episode. In the Caribbean, Jamaica recorded 12.9% growth in agricultural value added in 2016. In the Southern Cone, Argentina experienced a 23.4% decline in 2023, followed by a 30.8% rebound in 2024. Meanwhile, in the Andean region, Peru moved from a 3.7% contraction in 2023 to 5.9% growth in 2024.
These contrasts highlight the heterogeneity of agricultural performance across countries and periods. Although some coincide with El Niño episodes, the observed changes also reflect other climatic, productive, and economic factors and therefore cannot, on their own, be interpreted as impacts attributable to the phenomenon.
What do studies reveal about past and future economic impacts?
Changes in GDP and agricultural value added during El Niño episodes can reveal patterns in economic performance, but cannot, by themselves, establish causal relationships. It is therefore important to identify and systematically document studies that provide statistical or scientific evidence on the effects of the phenomenon on economic activity, particularly those estimating impacts on GDP, economic losses, growth rates, and prices. Research quantifying the consequences of droughts and floods is also relevant, even when these events have not been specifically attributed to El Niño.
PAESA enables users to explore this evidence, which is updated regularly, through its searchable repository of research findings and documented results. For example, users can search for keywords such as "GDP" or "inflation" and combine them with tags such as "ElNiño", "Droughts", and "Floods". Advanced search options allow results to be filtered by sector, country, and other dimensions. Evidence records provide access to original sources and help distinguish observed impacts, economic estimates, and prospective scenarios.
The evidence compiled helps quantify the economic consequences of past climate-related events and explore the potential impacts of future events. For example, agricultural sector losses in Uruguay associated with the 2022–2023 water deficit were estimated at USD 1,741 million, equivalent to 3% of recent average GDP. Regarding the effects of El Niño on economic activity, an IMF study estimated cumulative losses of approximately 1% of GDP by the sixth quarter following a strong El Niño episode for a group of Central American and Andean countries.
Searching for inflation reveals additional channels through which economic impacts are transmitted, particularly through food prices. In Colombia, Abril-Salcedo and colleagues (2020) estimated a cumulative response of approximately 7.3 percentage points in food inflation between the fifth and ninth months following an El Niño-related shock. For Peru, Aguirre and colleagues (2025) estimated that, one year after an El Niño episode, the consumer price index could be approximately 4% higher than in the counterfactual scenario. However, findings are not uniform: an Inter-American Development Bank study on Ecuador found no statistically significant recent effects on inflation.
Research also helps anticipate risks. For example, the Central Reserve Bank of Peru estimated that a weak coastal El Niño episode could reduce economic growth in 2026 by 0.1 percentage points, while other studies identify potentially much larger impacts under more intense scenarios. Similarly, estimates of inflationary effects help assess how climate-related shocks may affect food prices and, in turn, purchasing power, food security, and household well-being.
These findings underscore the importance of distinguishing observed losses, estimated effects, and projections conditional on different scenarios, as well as changes in GDP, inflation rates, and price levels. They also show that economic consequences depend on the intensity of the phenomenon, productive structures, and the vulnerability conditions of individual countries.
PAESA's evidence repository complements the indicators presented above by moving beyond the identification of economic trends toward a more evidence-based understanding of the impacts of climate-related phenomena, their transmission channels, and their implications for public policy and investment decisions.
02 · Climate Vulnerability and Readiness
An important dimension in understanding the potential effects of El Niño is the degree of countries' vulnerability and readiness to address climate-related risks. Although these conditions do not, by themselves, determine the impacts of any particular episode, they provide a useful indication of the context in which such impacts may occur and the capacities available to respond. The Notre Dame Global Adaptation Initiative (ND-GAIN) index, developed by the University of Notre Dame, provides a comparative assessment based on two complementary dimensions: vulnerability to climate change, which considers exposure, sensitivity, and adaptive capacity; and readiness, which reflects the economic, institutional, and social conditions that facilitate investment and adaptation efforts. The composite index is expressed on a scale from 0 to 100, with higher scores indicating relatively more favorable conditions.
The map highlights important differences among countries across the Americas. For example, in 2023, Canada recorded approximately 68 points, Costa Rica 54, Mexico 48, and Bolivia 43. These contrasts reflect different combinations of vulnerability and readiness, helping explain why countries may face different circumstances when confronted with climate-related hazards such as droughts, floods, and other disturbances associated with El Niño. The map's colors facilitate regional comparisons using intervals defined by PAESA, which do not represent official ND-GAIN categories.
The dashboard allows users to select a country and explore changes in its index between 2016 and 2023, identifying changes in its score and comparing its situation with that of other countries in the region. Changes may be gradual and may not necessarily result in a different color category. This perspective complements the analysis of economic and agricultural performance by providing information on the structural conditions that may influence countries' capacity to anticipate, respond to, and adapt to climate-related risks.
03 · Social Context
The social dimension is also important when examining the potential impacts of El Niño, as social conditions and vulnerabilities can significantly influence their severity across countries. One relevant approach is to examine vulnerability to food insecurity. Countries with higher levels of food insecurity vulnerability may experience more severe consequences from extreme climate events, particularly when these conditions coincide with greater environmental vulnerability, as discussed in the preceding section.
Explore the following map showing the food insecurity vulnerability index developed by IICA, which ..... It allows users to compare relative vulnerability across Latin America and the Caribbean and other regions, as well as examine how it has evolved over time.
A preliminary assessment of the 2024 results indicates that .....
Comparing the two dimensions—food insecurity vulnerability and climate resilience, as presented above—may help identify countries such as x1 and x2 that could be more exposed to the impacts of El Niño than other countries, such as .....
Explore exposure, vulnerabilities, and impacts
The intensity of El Niño alone does not determine its consequences for agrifood systems. Impacts also depend on local climatic conditions, production systems, territorial exposure, vulnerabilities, and response capacities.
The following charts allow users to explore the historical intensity of El Niño, the probabilities of its future evolution, and differences in agrifood productivity associated with previous episodes. The analysis combines observations, forecasts, and historical stress scenarios, which should be interpreted as tools for understanding and anticipating risks, rather than as predictions of specific losses.
01. How intense is El Niño compared with previous events?
The Oceanic Niño Index (ONI) allows comparisons of the intensity of El Niño episodes recorded since 1950. In July–September 2026, it reached +2.2 °C, a value within the very strong intensity category and higher than the maximum recorded during the 2023–2024 episode.
How is it measured? The ONI calculates the three-month running average of sea surface temperature anomalies in the Niño 3.4 region of the Pacific Ocean. To identify a historical episode, a threshold of ±0.5 °C is applied over at least five consecutive overlapping three-month periods. Intensity is classified according to the maximum value reached.
Key takeaway: The observed ocean warming has reached historically high levels. However, greater El Niño intensity does not necessarily imply more severe or uniform agrifood impacts across countries and territories.
02. How likely is El Niño to intensify or persist?
Forecasts allow users to explore the probability that El Niño conditions will persist and that the event will reach exceptional intensity. In October 2026, NOAA estimated an 83% probability that the Relative Oceanic Niño Index (RONI) would reach or exceed +2.5 °C during October–December. IRI forecasts also indicated a high probability of El Niño persisting during the first months of 2027, followed by a gradual decline.
How is it estimated? These probabilities are derived from climate forecasts that combine observations with oceanic and atmospheric models. The RONI measures warming in the Niño 3.4 region relative to the rest of the tropical oceans, while the ONI is used here for historical comparisons. Estimates refer to specific forecast periods and are revised as new information becomes available.
Key takeaway: Forecasts provide opportunities to anticipate risks and prepare responses. However, a high probability of El Niño does not imply an equivalent probability of droughts, floods, or agricultural losses in a specific territory.
How are potential productivity impacts estimated?
The following two charts present a historical stress scenario developed using FAOSTAT data for 1961–2024. Productivity observed during previous El Niño episodes is compared with its long-term trend and with deviations recorded during ENSO-neutral years.
Calculation methodology: The historical trend is estimated using the Hodrick-Prescott filter applied to the logarithm of the productivity series. For each El Niño intensity category, average percentage deviations from this trend are calculated, net of the corresponding deviations during neutral years. The predominant direction of the deviations is then identified, and the largest average deviation in that direction is selected for each product and country.
The results represent historical associations under a stress scenario, not demonstrated causal effects or forecasts of losses for 2026–2027.
03. Which countries show the largest differences in agrifood productivity?
The chart presents estimated deviations in agrifood productivity from its historical trend under the stress scenario. In several Central American and Caribbean countries, negative deviations range approximately from 4% to 6.5%, while Argentina (+4.1%) and Brazil (+1.7%) show positive results.
How is the country-level result calculated? Estimated deviations for individual products are aggregated using each product's production value as a weight. National averages may conceal significant differences across products, territories, and producers.
Key takeaway: Historical outcomes associated with El Niño are heterogeneous. Although the regional average under the scenario is slightly positive, influenced by the weight of Argentina and Brazil, several countries show significant negative deviations. Regional results may conceal risks affecting specific production systems and territories.
04. Which agricultural products show the largest differences?
Historical responses also vary considerably across products, even within the same country. In Central America, the scenario shows negative deviations ranging from 5% to 18% for maize yields and from 4% to 11% for rice yields.
In Argentina, positive deviations are observed for maize (+5.9%) and wheat (+13%), while wheat in Brazil shows a negative deviation of 23%. These differences demonstrate that favorable national results may coexist with significant negative outcomes for specific crops.
How is it calculated? The same historical methodology is applied, using yield per hectare for crops and production per animal for livestock products. Results are presented separately by product and country.
Key takeaway: Differences across products highlight the importance of complementing national averages with assessments of specific crops, production activities, and territories. This information helps identify priorities for prevention, adaptation, and the protection of rural livelihoods.
What do these findings imply for anticipatory action?
The main conclusion of the analysis is that El Niño intensity does not automatically determine the magnitude of its impacts on agrifood systems. To guide decision-making, climate forecasts must be combined with information on exposure, vulnerabilities, and response capacities in each territory.
The results help identify where risks may be concentrated and which activities require closer monitoring, without replacing local assessments. Preparedness measures should be reviewed as forecasts evolve and new evidence on impacts becomes available.
Source and methodology: Piñeiro and Gianatiempo (2026). El Niño and Its Potential Impacts on Agrifood Systems in Latin America and the Caribbean. IICA Blog. The article presents the sources, classification criteria, and methodology used to construct the historical scenarios.
Note: Climate data and forecasts correspond to the publications used in October 2026. They should be updated as El Niño conditions evolve. The productivity scenarios are based on historical information for 1961–2024 and remain a reference until the data series are updated and the methodology is reapplied.
Compare the responses adopted
Examine the policy frameworks, institutional arrangements, prevention and response measures, and public investment initiatives implemented across countries and territories.
Assess what works and the lessons it offers
Identify good practices, results, enabling conditions, limitations, and lessons that may be relevant to other contexts.
Guide collective action
Highlight priorities for action, coordination needs, technical cooperation opportunities, and potential interventions or investments to strengthen anticipatory action, adaptation, and resilience



Comments
Read all commentsKarla Vega
25/05/2026Kelly Johana Nieves Coca
24/04/2026